


When games were first becoming popular on Facebook and later Mobile, not many people foresaw that cow-clicking or virtual slots that never payout, would be successful game concepts. Those concepts have generated billions & billions of dollars.
Facebook and Mobile taught the games industry the importance of data science. What will be the Candy Crush, Double Down, or Clash of Clans of VR? Unless you work for Oculus, Samsung, or Valve, you likely don’t have much data to back-up your opinion.
VR is currently in the hands of close to 1.5 million users, despite still being around six months away from the first ‘consumer launch.’ The fervor of the enthusiast and development community has placed us in the middle of one of the largest collective best user testing periods, in the history of content distribution. John Carmack has recently stated that Experiences seem to be slightly out-performing Games on the Gear VR.
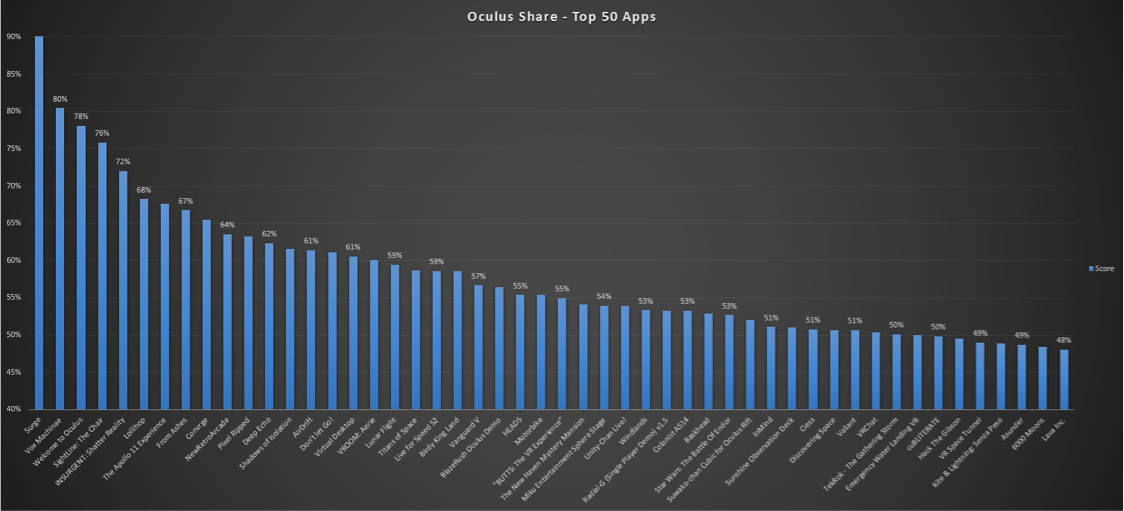
I wanted to get a better sense for what content was performing well. Oculus provides a Top Rated list, which is helpful, though they also provide other interesting data. I did some analysis of the available data on Oculus Share, and made up a relative scoring system. I simply called it Score, which is represented as a percentage.
Methodology
I looked at each app, with a Rating of 3.0 or higher (arbitrary cut-off point). Given the available data, the most interesting metrics to me were Downloads per Day and number of Ratings per Download.
Downloads per Day tells us roughly how popular the app is. Though this is influenced by a number of external factors. Such as appearance on the Oculus Share homepage, the developer’s marketing efforts, Reddit and other media sites, etc.
I use number of Ratings per Download, as a proxy for how passionate users are about the app. The higher percentage of users that Rate the app, the more likely the app impacted them in some way. If the app’s Rating is above average, chances are that impact was mostly positive.
The final Score incorporates the app’s Rating, Downloads per Day, and Ratings per Download (equally weighted).
Categories and Genres
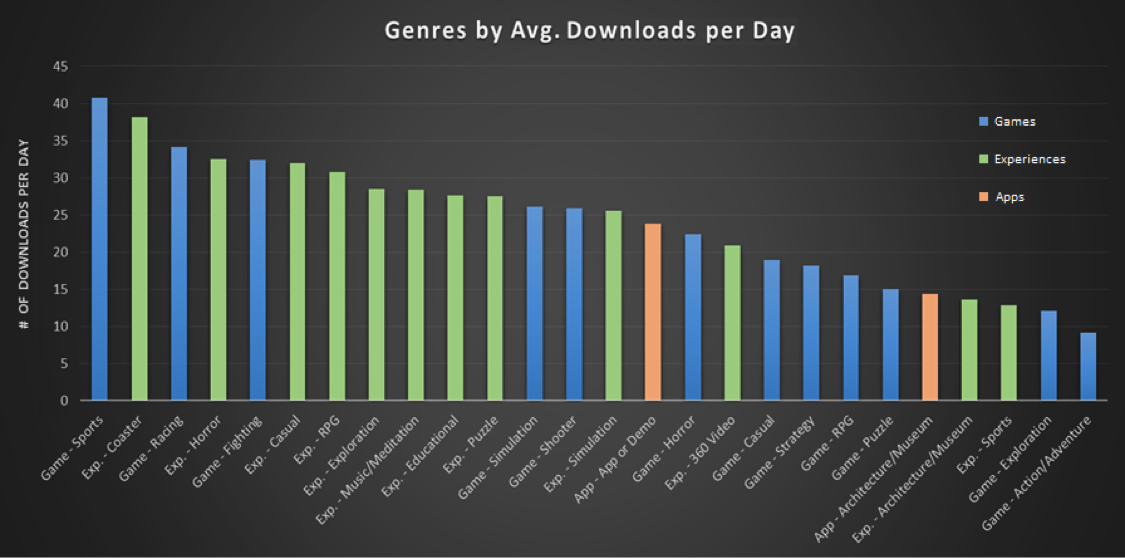
I also wanted to look at how the Categories and Genres of apps were performing. First I looked at which Categories and Genres were being downloaded the most. Note that this shows the Average Number of Daily Downloads, per title within that Genre.
This next table below shows most of the interesting information, split out by Category and Genre. Note that the Number of Apps in each Genre varies from 3 to 33. Any Genre with a low number of apps, you should take the averages with a grain of salt – for example the Sports genre is skewed up by a few titles and the fact there are a relatively small number of titles in the category (38).
As Carmack has suggested, you can see that Experiences are averaging 28.4 downloads per day, while Games are only averaging 23.2 downloads per day. However the quality metrics are slightly lower for Experiences. That suggests that while the demand for Experiences is high, most developers haven’t yet learned how to craft a high quality Experience in VR yet. Specifically Coasters seem to be quite popular, though suffer from relatively poor quality metrics (as you might expect).
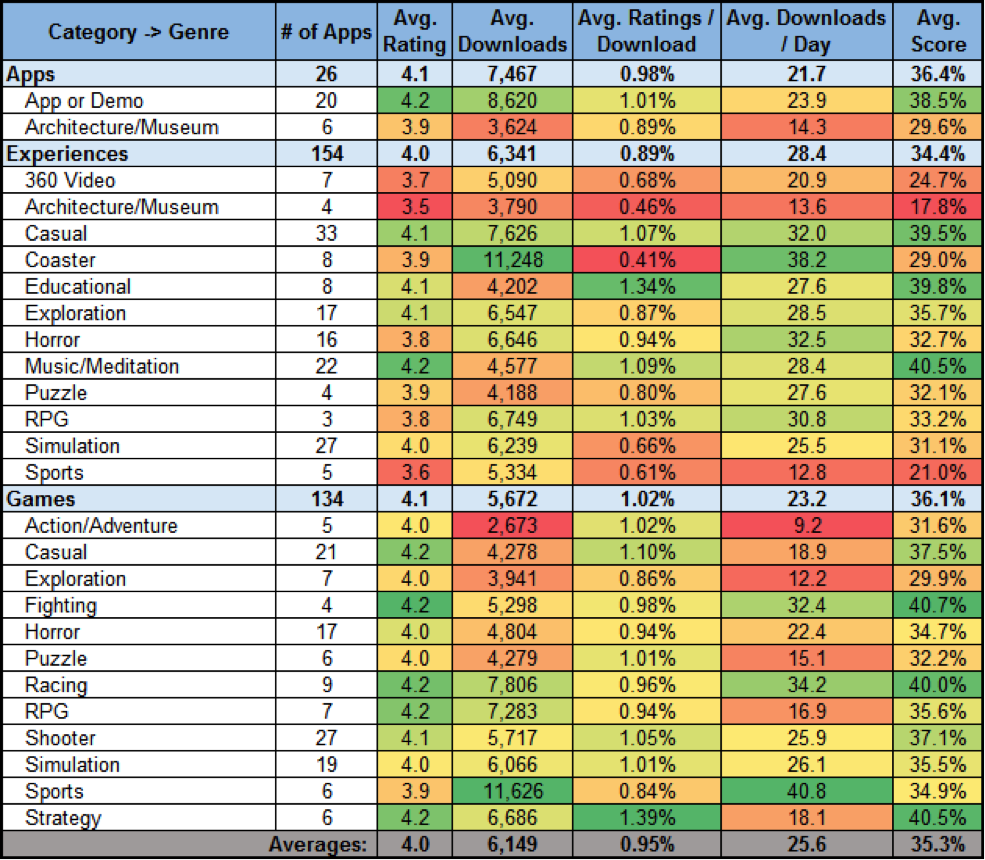
Besides averages, there are also some pretty eye-popping grand totals. As of June 7th, there are 719 pieces of content available on the Oculus Share store. Those 719 pieces of content have been downloaded a grand total of 2,341,946 times – a big milestone for sure.
You can download the raw data I collected here. In it you can find a Pivot Tablet, where you can drill into specific apps in the table above. Please feel free to do your own analysis. Also look for a follow-up article where I review why Surge is performing so well.
Some caveats to note:
- The data was pulled on May 30th.
- Keep in mind that this data is purely based on Oculus Share activity, which has a relatively small sample size.
- Very few apps are of polished consumer quality. So just because an App or Genre isn’t currently performing well, doesn’t mean it won’t be very successful.
- The current user base generating this data, is comprised mostly of developers and early adopters. Consumer preferences will likely differ.
- Apps with under 1,000 Downloads have a particularly small sample size, and some of the data looks off. Though I decided to keep them in the analysis.
- I wasn’t particularly happy with the Oculus Category and Genres of apps, so I tweaked them a bit. For example I added the following Genres – App or Demo, Coaster, Music/Meditation, and Architecture/Museum, and reclassified some apps.
 Thanks to Jason McMahon for collecting this data and helping to craft it into a piece. McMahon is the “Studio and Product Guy” at Presence Labs, a 20 person VR studio located in Seattle. Presence Labs is focused on the development of immersive music experiences for the emerging virtual-reality market. You can contact Jason via email or you can add him on LinkedIn.


