This week Virtualitics revealed it raised a $4.4 million Series A funding round led by The Venture Reality Fund.
The Pasadena-based startup promises to use VR and AR to better analyze large amounts of data, with the funding round expected to expand the company’s team and help speed up the addition of new features. I traveled down to the company’s offices for a better understanding of how the software works and came away impressed by its potential.

Extra Dimensions For Quicker, Deeper Understanding
I used an Oculus Rift and was joined in VR by co-founder Michael Amori, who was wearing a headset in a room nearby. In VR, Amori was sitting immediately to my left as he showed me the software. The very first demonstration, being that it is collaborative of course, allowed multiple people from around the world to join the shared virtual world and examine the data together. He used Oculus Touch controllers to make selections from spreadsheets of data he loaded.
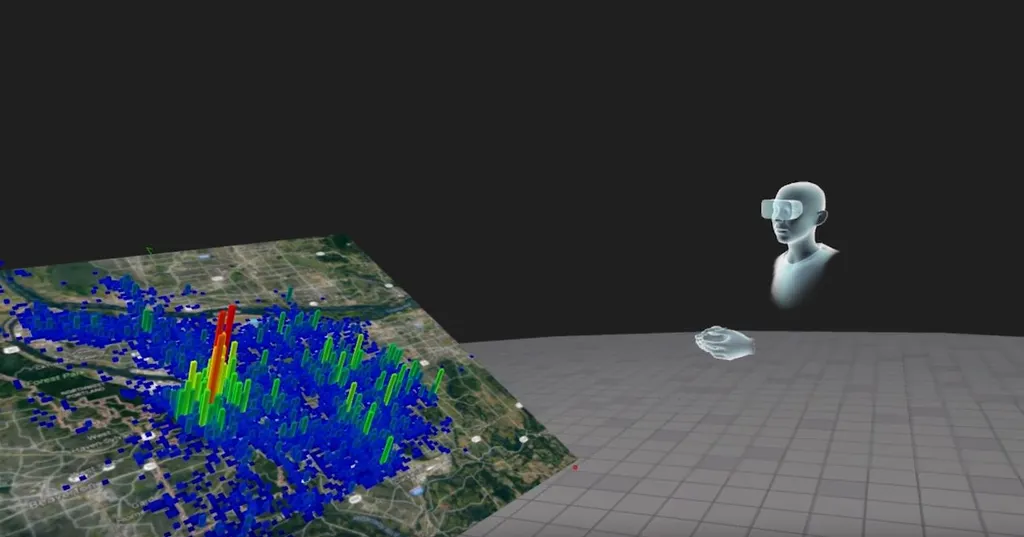
One sheet was from the 1990 U.S census, with numerous metrics collected for each community in the United States. Amori selected a single metric from the sheet for which he wanted to understand better relative to the rest of the data. For example, in the census data it was the crime rate in a large community. From 120 columns of data, an algorithm picked out that the percentage of kids in a family home with two parents and percentage of kids born out of wedlock and median income were all together correlated to crime rate. Suddenly I was facing a data cube that plotted out cities from across the United States across the axis identified by the algorithm, letting me instantly visualize the way this data related.

Areas with blue dots had relatively low crime, while red dots had high crime — each generally separated into two different regions. I could easily move my head to search for patterns in the data. In one area of the graph, there was a single blue dot in a region of red dots indicating it had a similar percentage of kids with two parents and percentage of kids born out of wedlock and median income as high crime regions, but this particular community had lower crime. Selecting that single bubble brought up a browser page with info on that community.
As a journalist, this is where I started to get really interested. Any outliers in the data could be easily investigated through a browser window without removing the headset. So not only is Virtualitics trying to make it easier to spot patterns in data, it makes it easy to step outside the confines of that dataset and investigate further.
“Looking at this in VR gives you much more insight into the data than looking at a 2D graph,” Amori tells me in VR.
The company’s core team is comprised of data discovery experts and computer scientists and they are working with retailers, investors and even a “large newspaper” to help those organizations analyze data and find notable takeaways.
“Virtualitics is harnessing the power of VR/AR and artificial intelligence to present and analyze big data in an unprecedented way,” said Marco DeMiroz, co-founder and general partner at The VR Fund, in a prepared statement. “The company’s platform is truly transformative and can be applied to any industry that relies heavily on data analytics, representing tremendous market opportunity on a global scale.”
https://www.youtube.com/watch?v=FeR_cxAeVyo